Tracking the performance of your website and social media via analytics is a great way to drive business and retain customers, as I talked about in my previous article where I outlined three different types of tools that you can use for this purpose. Now, let’s get your virtual assistant started on the analytics journey with a quick tutorial.
In the startup world, “Pirate Metrics” has become almost a bible for fledgling companies looking to get off the ground. It outlines five main metrics that companies should be keeping track of to optimize their websites: acquisition, activation, retention, referral, and revenue. The acronym for each of these terms spells AARRR — and hence the origin of the name!
Every type of business needs to independently determine what success means for them, but here are simply simple metrics that your virtual assistant can start tracking now with Google Analytics, and an attached spreadsheet that can be modified to suit your goals.
ACQUISITION
Acquisition looks at how many new customers discover you and through which channels (ex: search engines, social networks, ad networks, etc.). While it doesn’t give you the whole picture, looking at how many new visitors come to your website is a good start when it comes to tracking how much awareness you’re generating among new customers.
To track this in Google Analytics:
1. Go to Audience -> Overview
2. Set the Date to encompass the week or month you’re interested in
3. From the Dropdown tab above the Overview section, add two segments: New Users and Returning Users
4. The Visits, New Users box will show you how many visits your site received that week. This is how many new users visited your site that have not visited before (ie. newly acquired visitors). Record this number in the spreadsheet in the Site Visits tab.


ACTIVATION
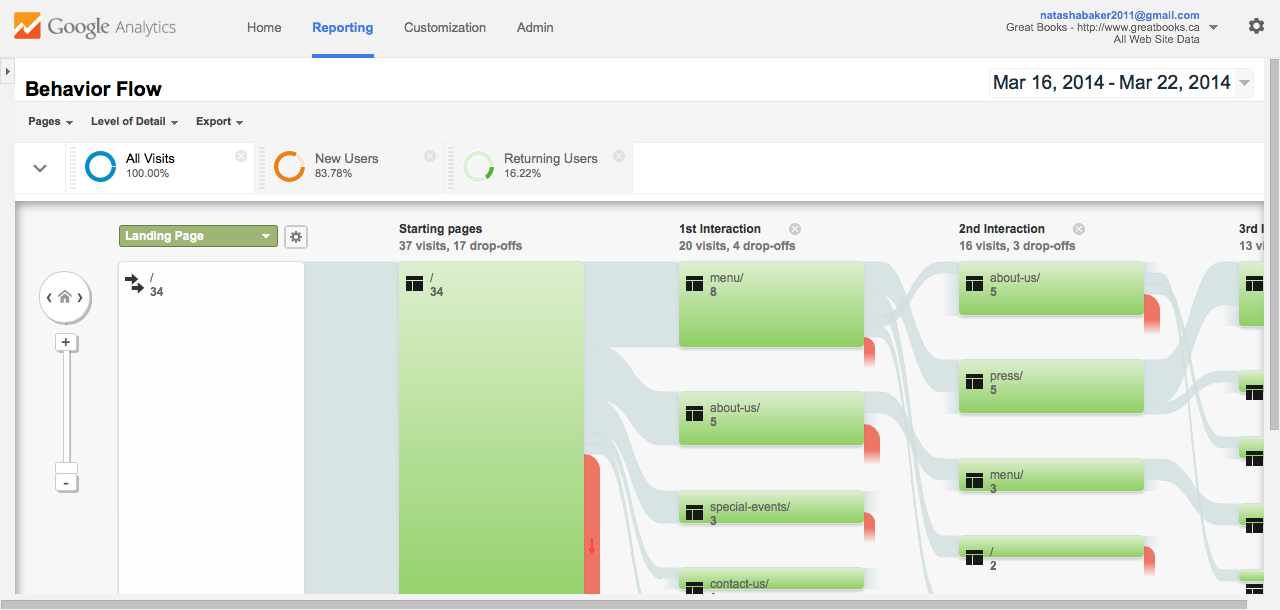
Activation is a measurements of how engaged your visitors are If you have a website with a community aspect or mailing list, your goal might be to convert a certain percentage of those visitors into signups. In this case, I’m tracking a restaurant’s visitors, which is defining an engaged user as one who visits at least two pages on the site, such as their Menu and About Us pages, which they believe will be a good indication that someone will enticed enough to come in for a meal.
To track this, go to:
1. Behavior -> Behavior Flow.
Record the number of visitors who successfully completed a second interaction


RETENTION
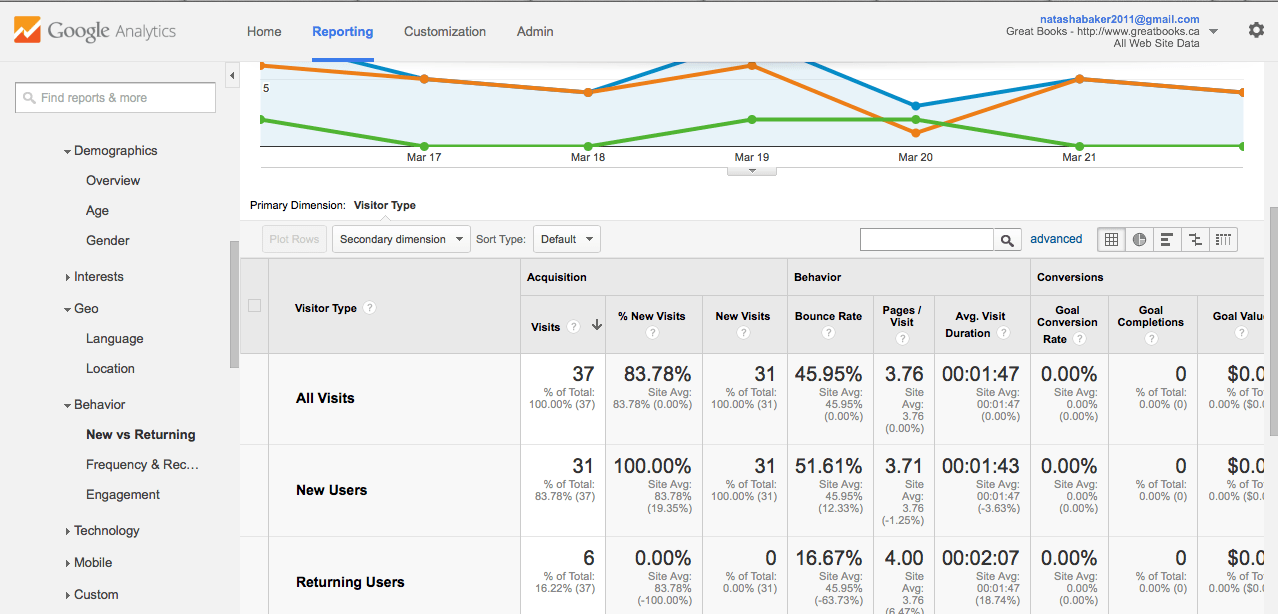
Retention is how often visitors are coming back to the website. For a cafe, website retention might not be that important. But for an e-commerce site or community, it’s crucial. Here’s how to track it:
1. In Behavior -> New Vs Returning, you’ll see metrics for average number of page views per returning visitor, average time spent on the site, and the overall percentage of returning users.


REFERRAL
Referral is a measure of “word of mouth” — how often people are talking about your website’s products and services online. This is the cheapest way to acquire new customers. This could include conversations on social media and blogs.
Here’s how to track it:
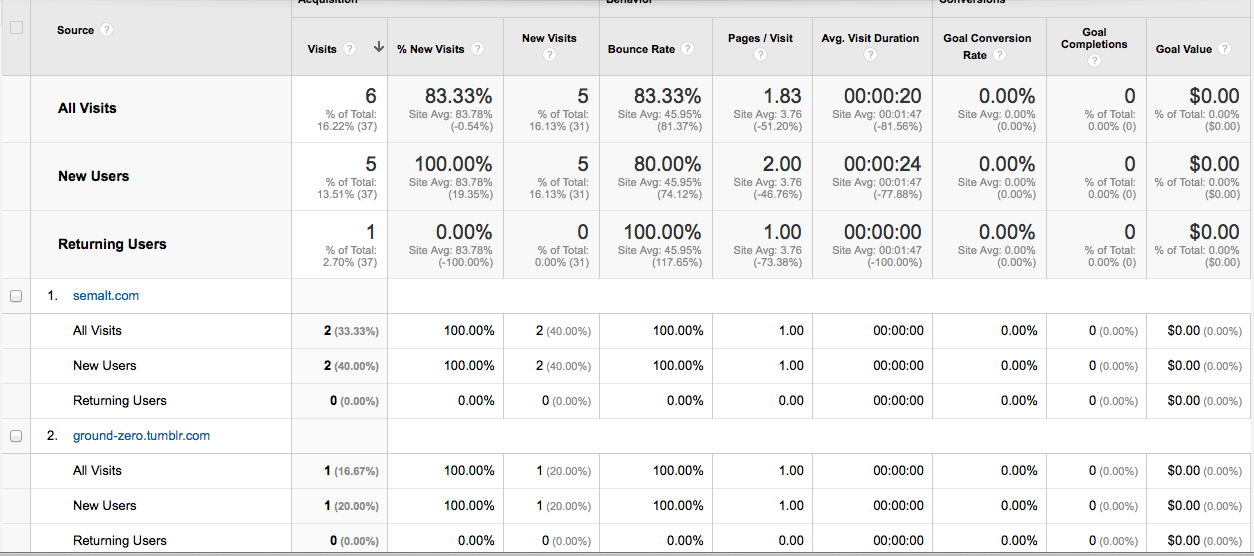
1. Go to Acquisitions – > All Referrals
2. Under All Visits, you will get the number of visitors who entered via a referral
Below that you can get a more granular view of how visitors are being referred to your site to see which referrals drive the most traffic.


Tracking analytics is a great way to determine how you can optimize your website to drive great business and engagement with customers, and measure the success of your marketing campaigns and website re-design efforts.


